Loading clusters back to Qupath
Givanna Putri
Last updated: 2025-11-28
Checks: 7 0
Knit directory:
2025_cytoconnect_spatial_workshop/
This reproducible R Markdown analysis was created with workflowr (version 1.7.2). The Checks tab describes the reproducibility checks that were applied when the results were created. The Past versions tab lists the development history.
Great! Since the R Markdown file has been committed to the Git repository, you know the exact version of the code that produced these results.
Great job! The global environment was empty. Objects defined in the global environment can affect the analysis in your R Markdown file in unknown ways. For reproduciblity it’s best to always run the code in an empty environment.
The command set.seed(20251002) was run prior to running
the code in the R Markdown file. Setting a seed ensures that any results
that rely on randomness, e.g. subsampling or permutations, are
reproducible.
Great job! Recording the operating system, R version, and package versions is critical for reproducibility.
Nice! There were no cached chunks for this analysis, so you can be confident that you successfully produced the results during this run.
Great job! Using relative paths to the files within your workflowr project makes it easier to run your code on other machines.
Great! You are using Git for version control. Tracking code development and connecting the code version to the results is critical for reproducibility.
The results in this page were generated with repository version b1fb153. See the Past versions tab to see a history of the changes made to the R Markdown and HTML files.
Note that you need to be careful to ensure that all relevant files for
the analysis have been committed to Git prior to generating the results
(you can use wflow_publish or
wflow_git_commit). workflowr only checks the R Markdown
file, but you know if there are other scripts or data files that it
depends on. Below is the status of the Git repository when the results
were generated:
Ignored files:
    Ignored:    .DS_Store
    Ignored:    data/.DS_Store
    Ignored:    data/imc/
    Ignored:    data/visium/

Untracked files:
    Untracked:  code/import_clustering.groovy

Unstaged changes:
    Modified:   analysis/imc_01.Rmd
Note that any generated files, e.g. HTML, png, CSS, etc., are not included in this status report because it is ok for generated content to have uncommitted changes.
These are the previous versions of the repository in which changes were
made to the R Markdown (analysis/imc_03.Rmd) and HTML
(docs/imc_03.html) files. If you’ve configured a remote Git
repository (see ?wflow_git_remote), click on the hyperlinks
in the table below to view the files as they were in that past version.
| File | Version | Author | Date | Message |
|---|---|---|---|---|
| Rmd | b1fb153 | Givanna Putri | 2025-11-28 | wflow_publish("analysis/imc_03.Rmd") |
Introduction
We can load the cluster annotation back to Qupath and visualise them.
Loading the clusters information to Qupath
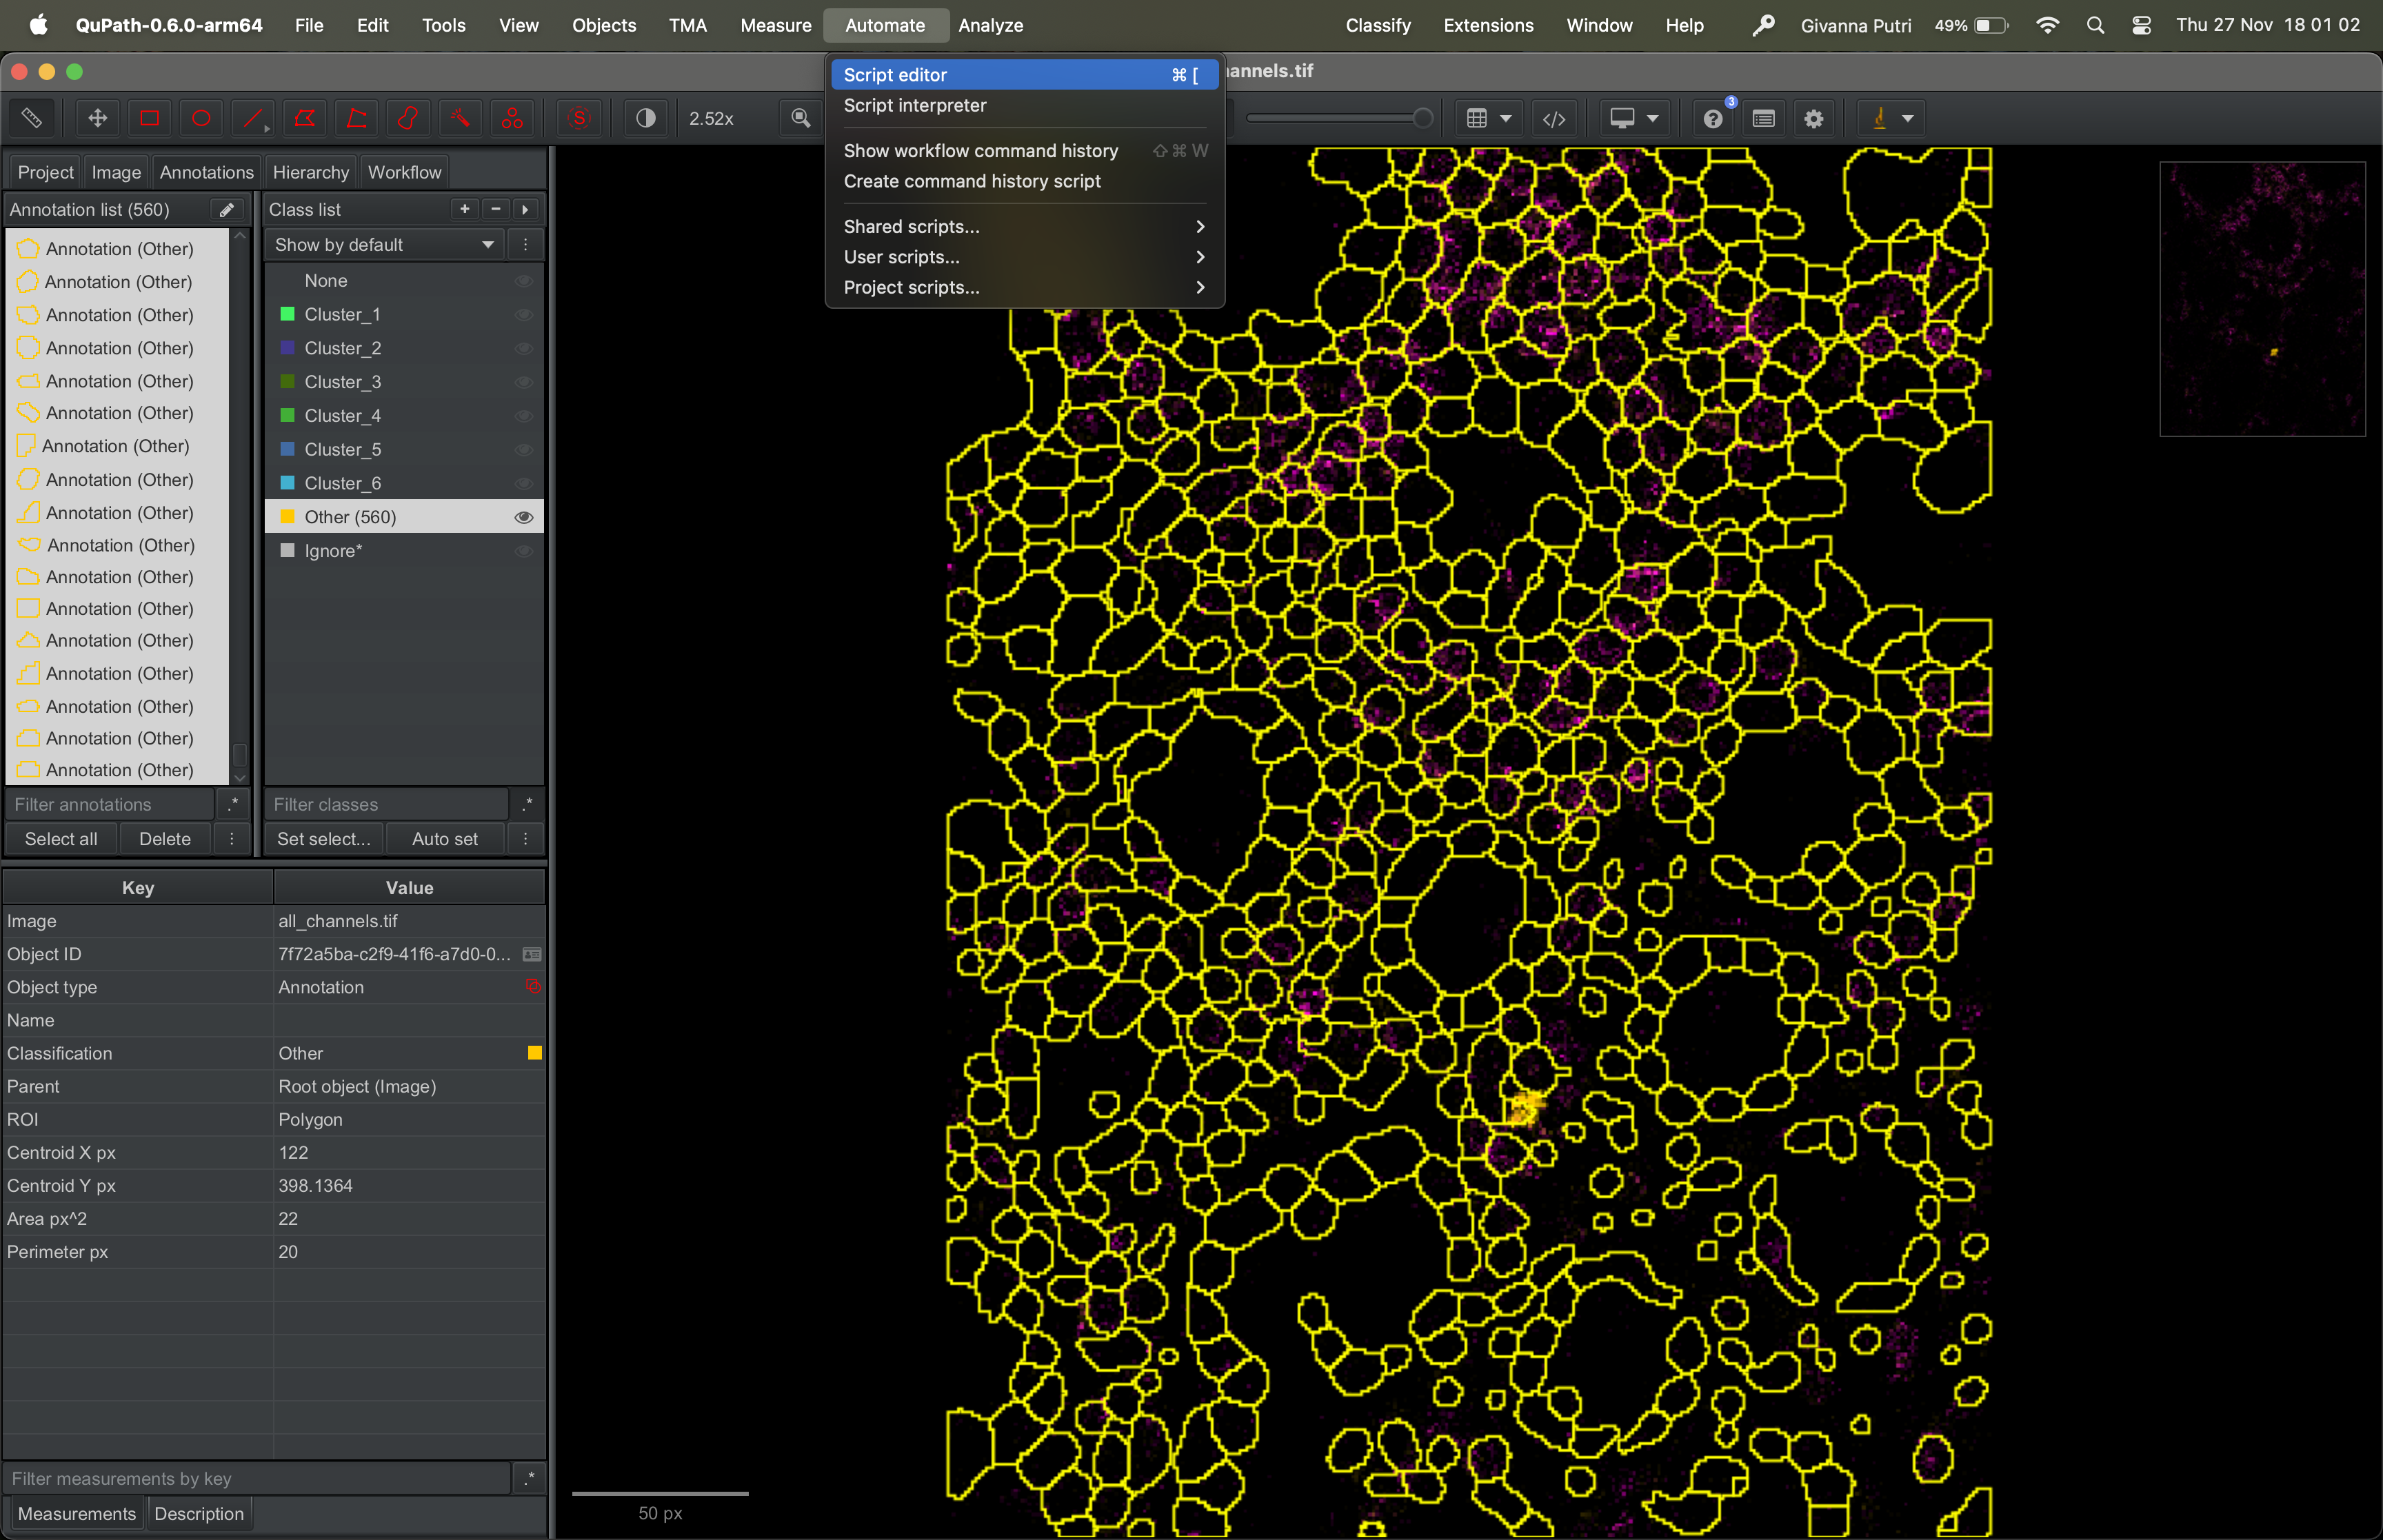
First, we have to use some custom script to load the csv file to Qupath. Go to Automate -> Script Editor.
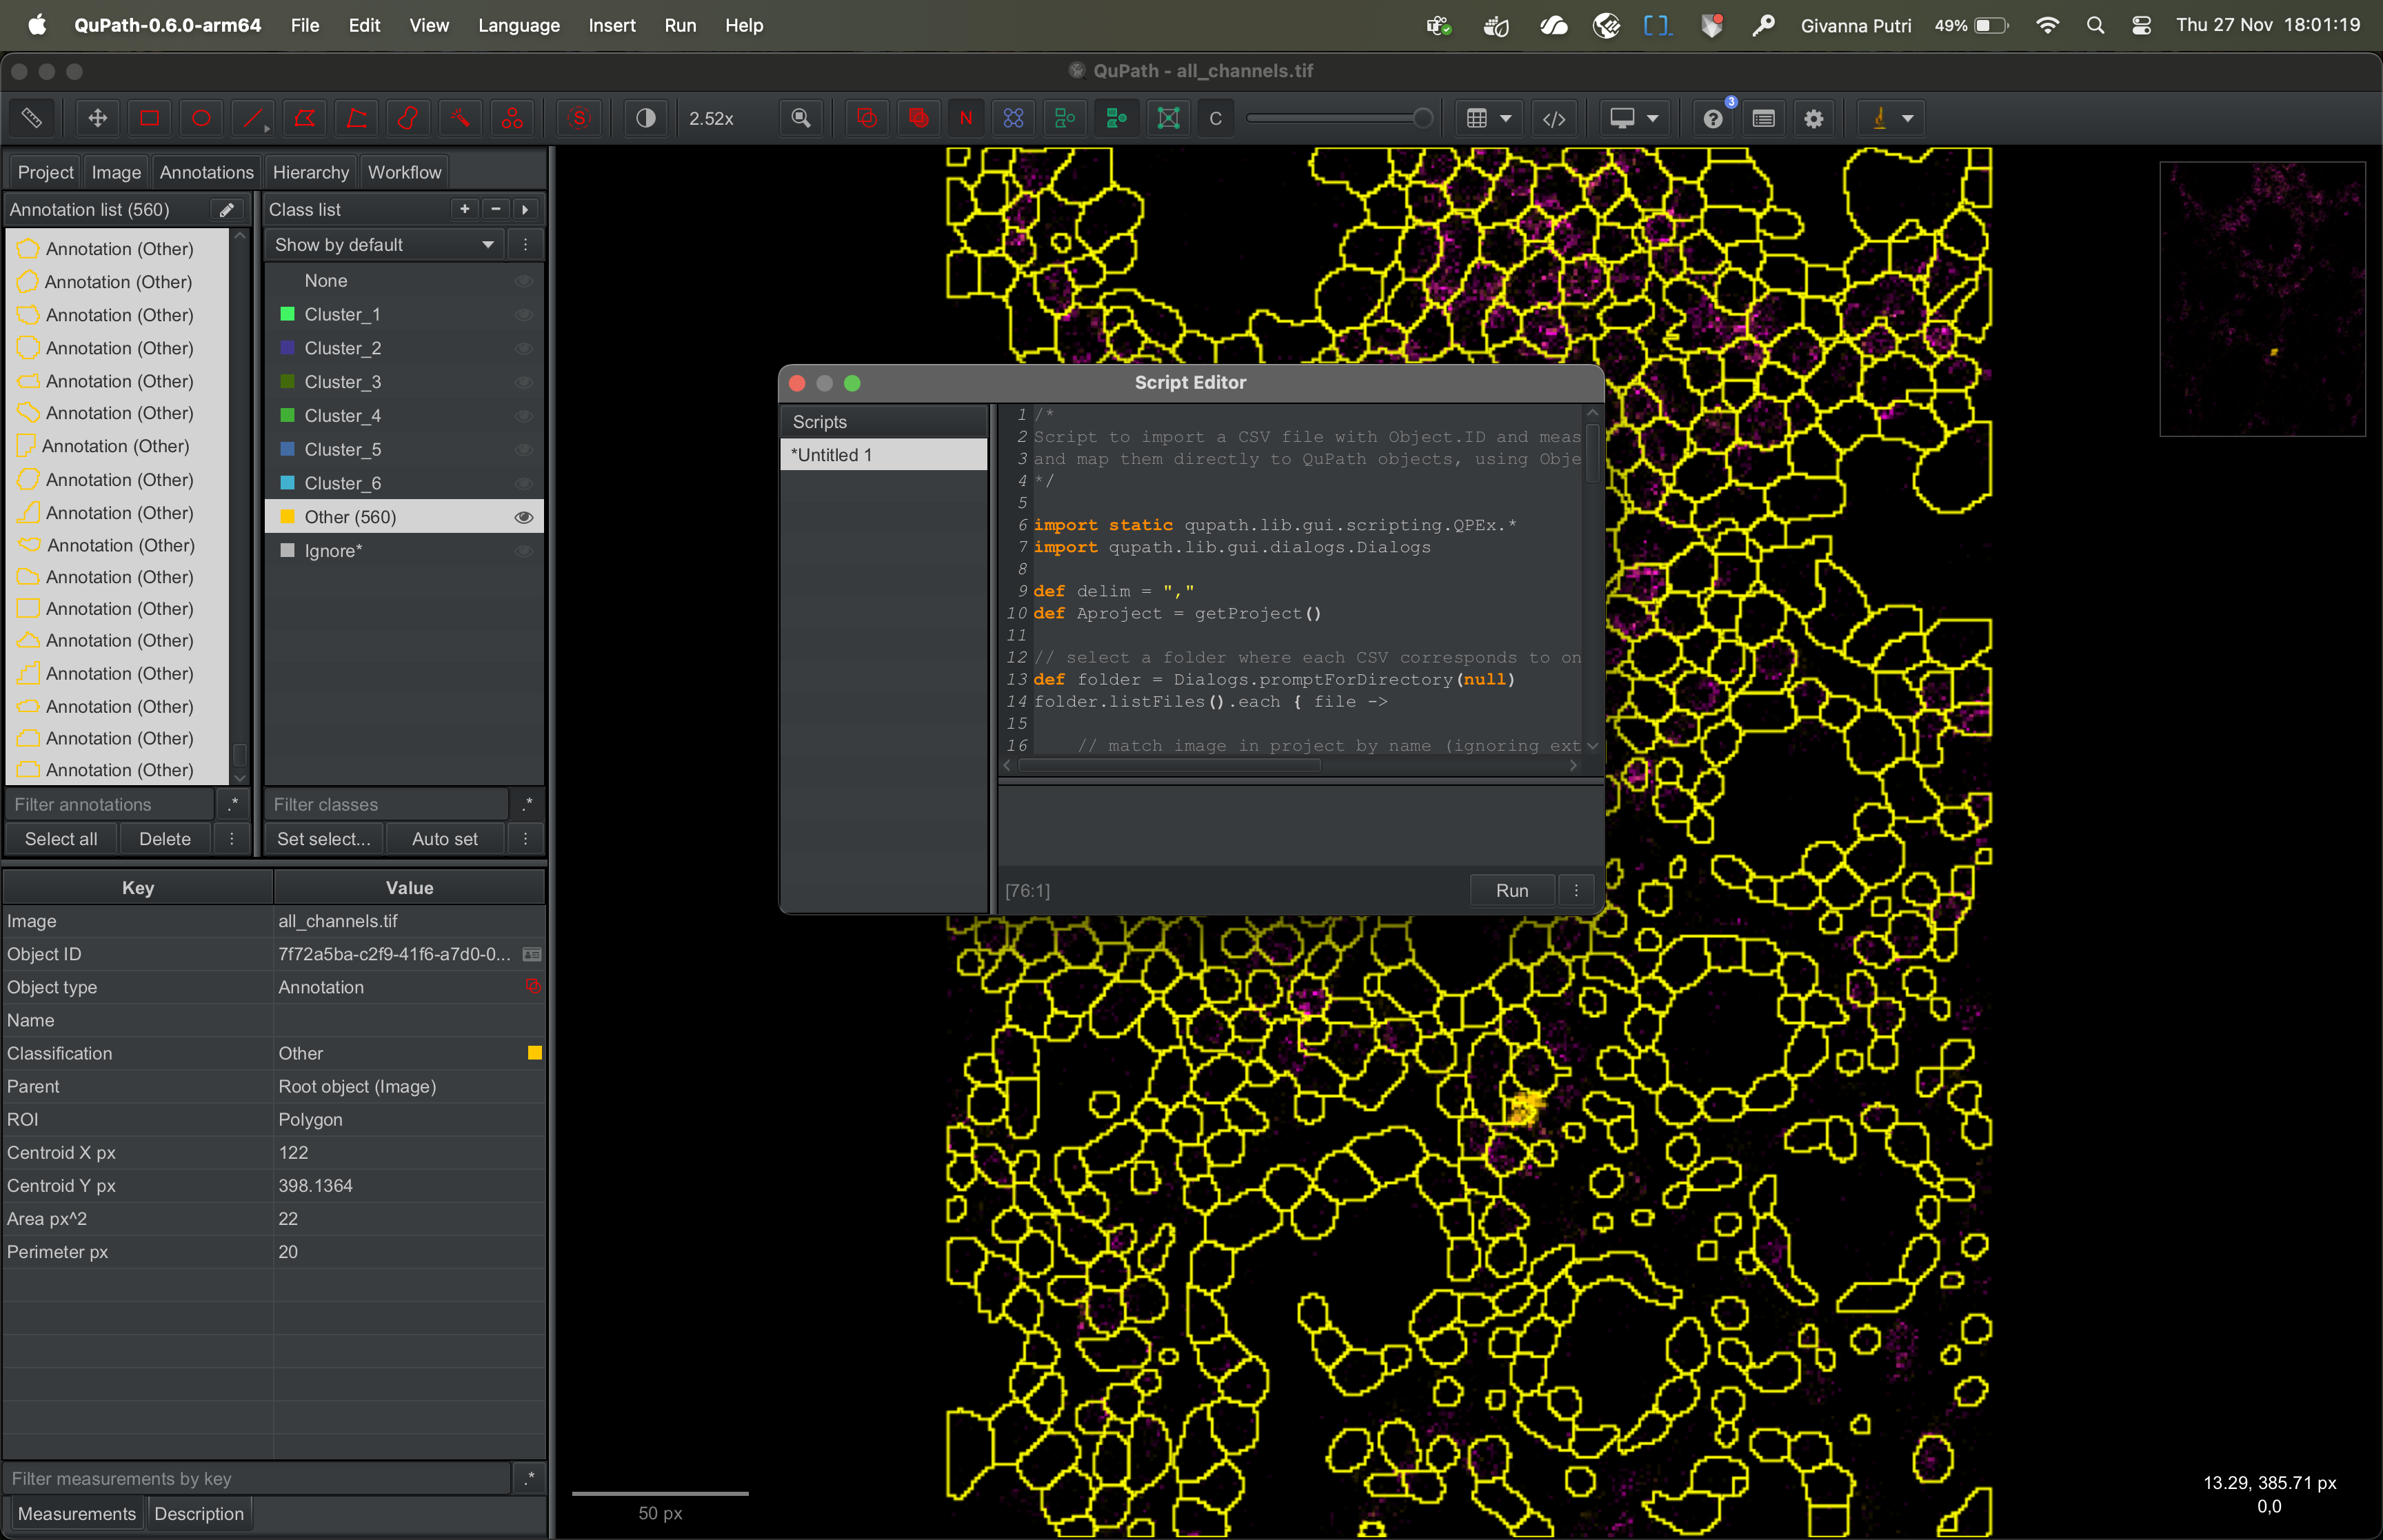
Copy the script that is in this Github link into the script editor. Then click run.
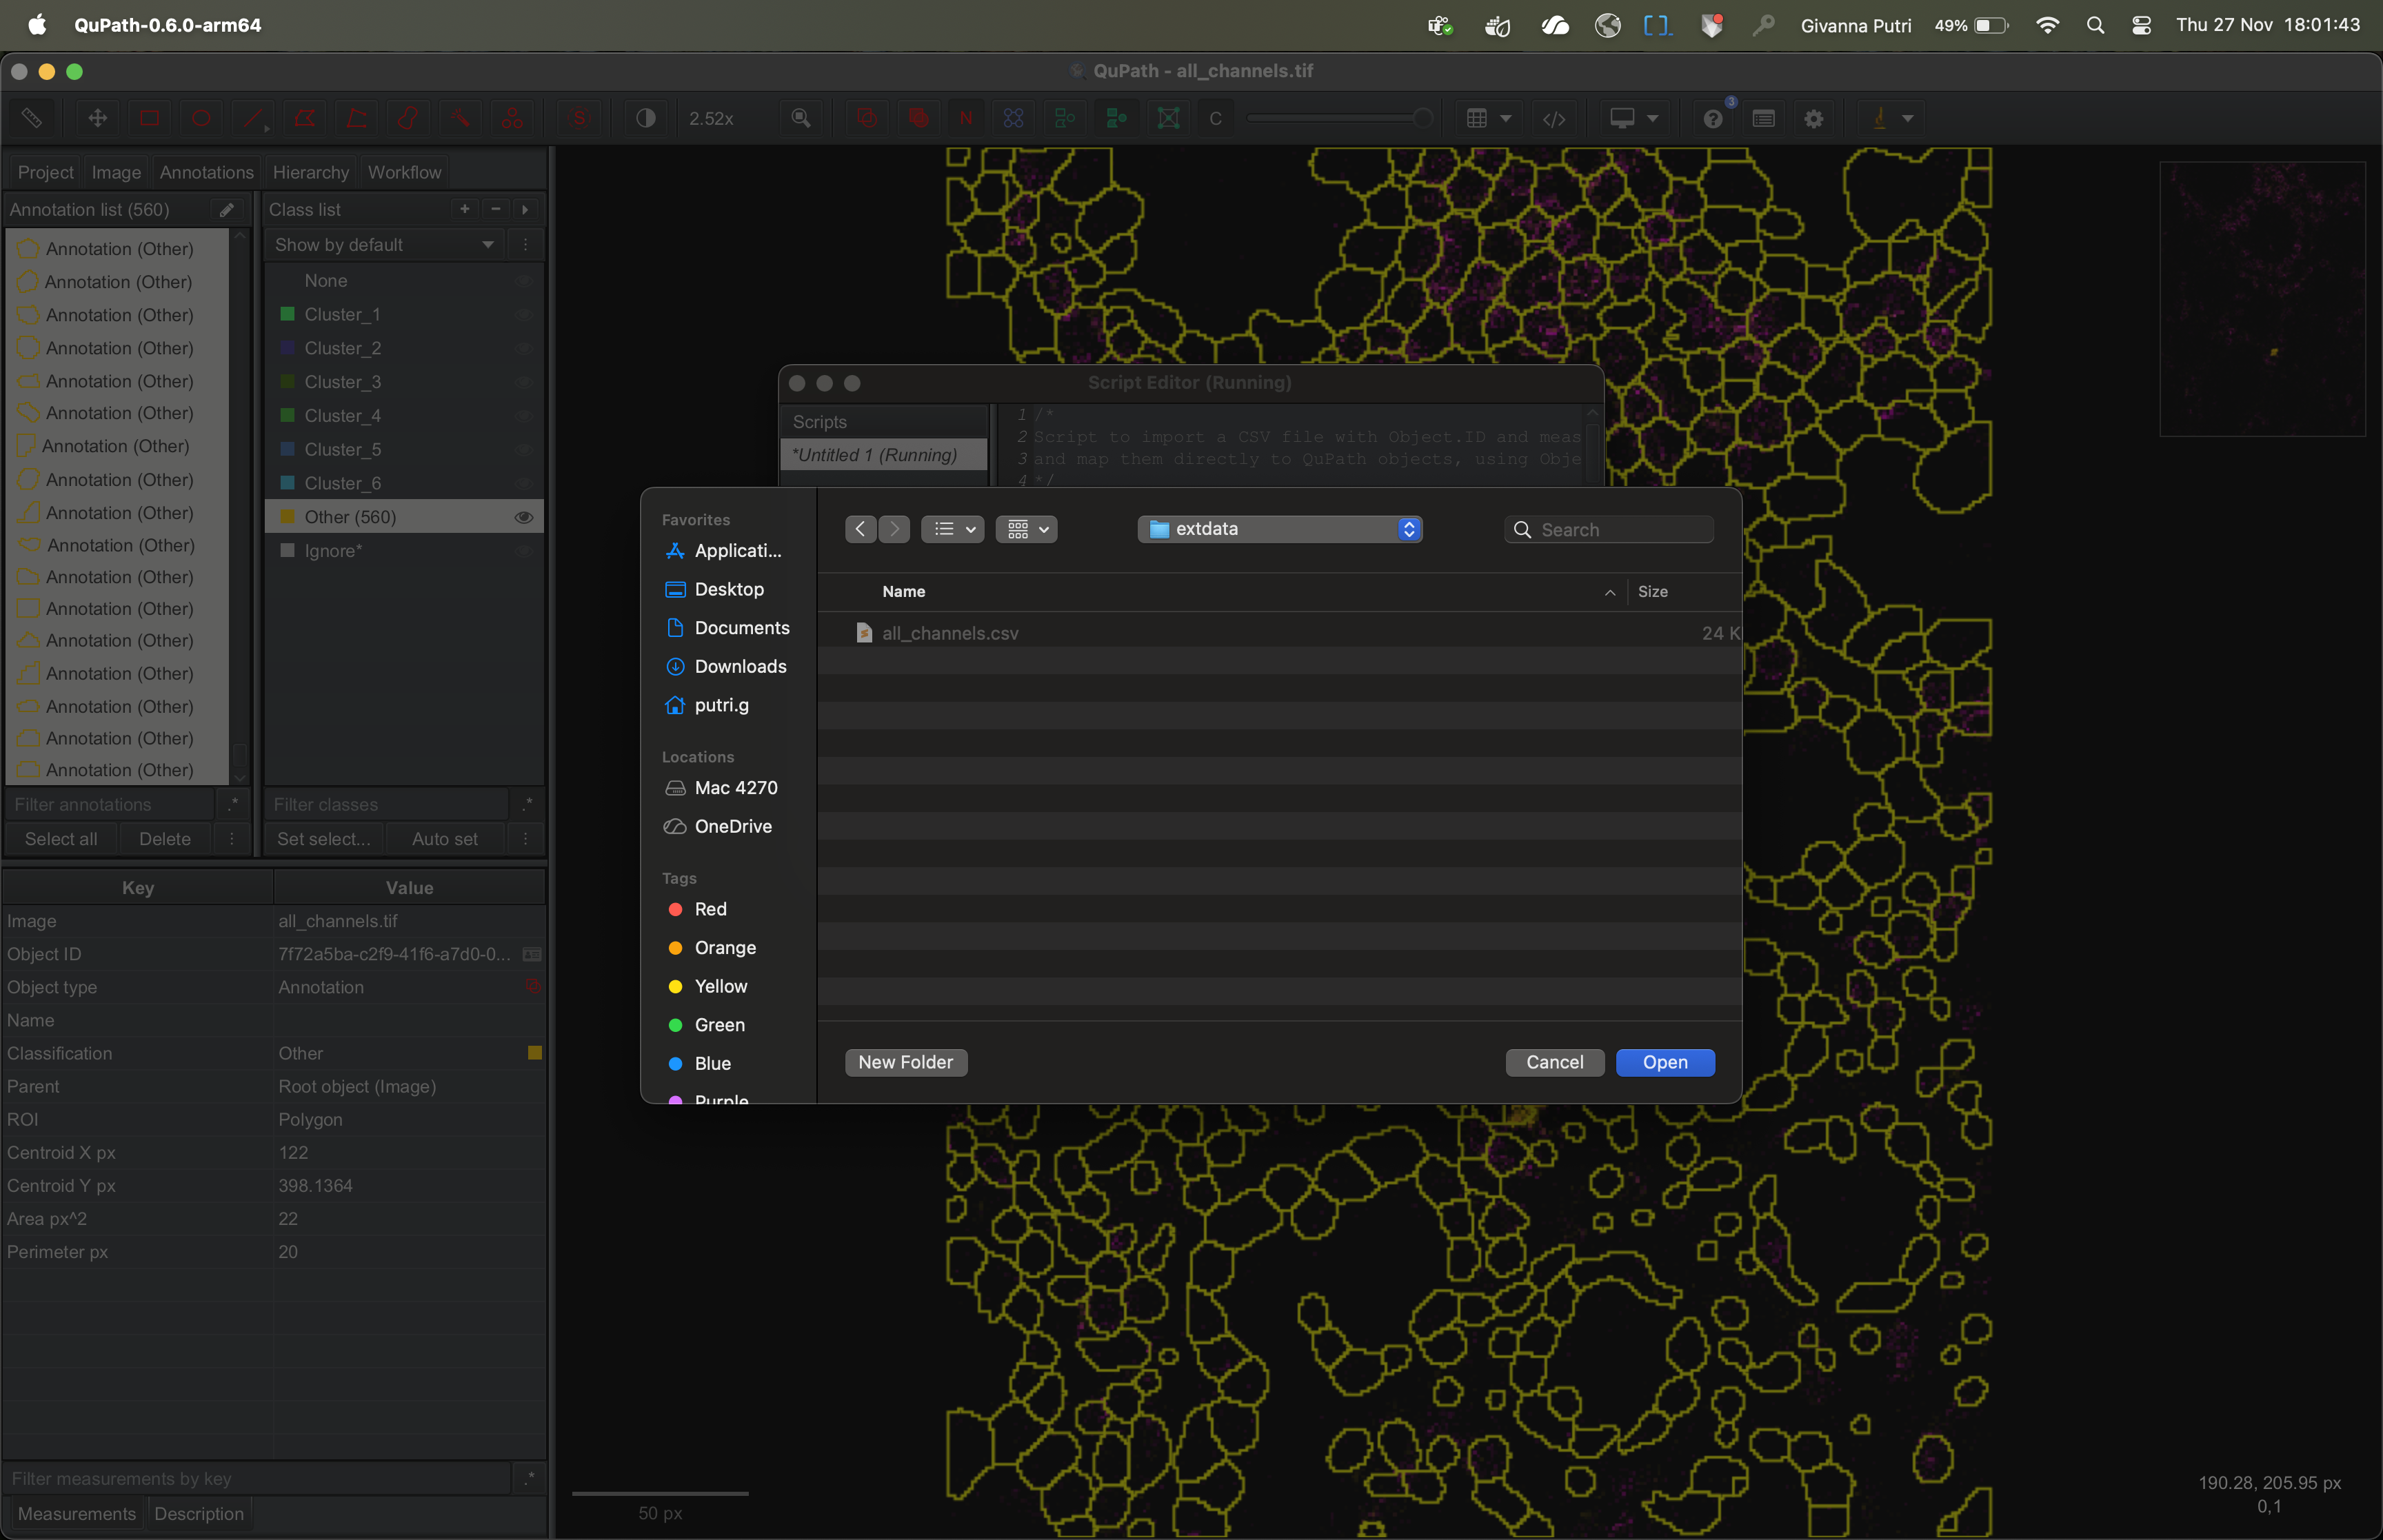
It’ll ask you to select the folder containing the csv file we
exported in imc_02. Select the appropriate folder and click
OK.
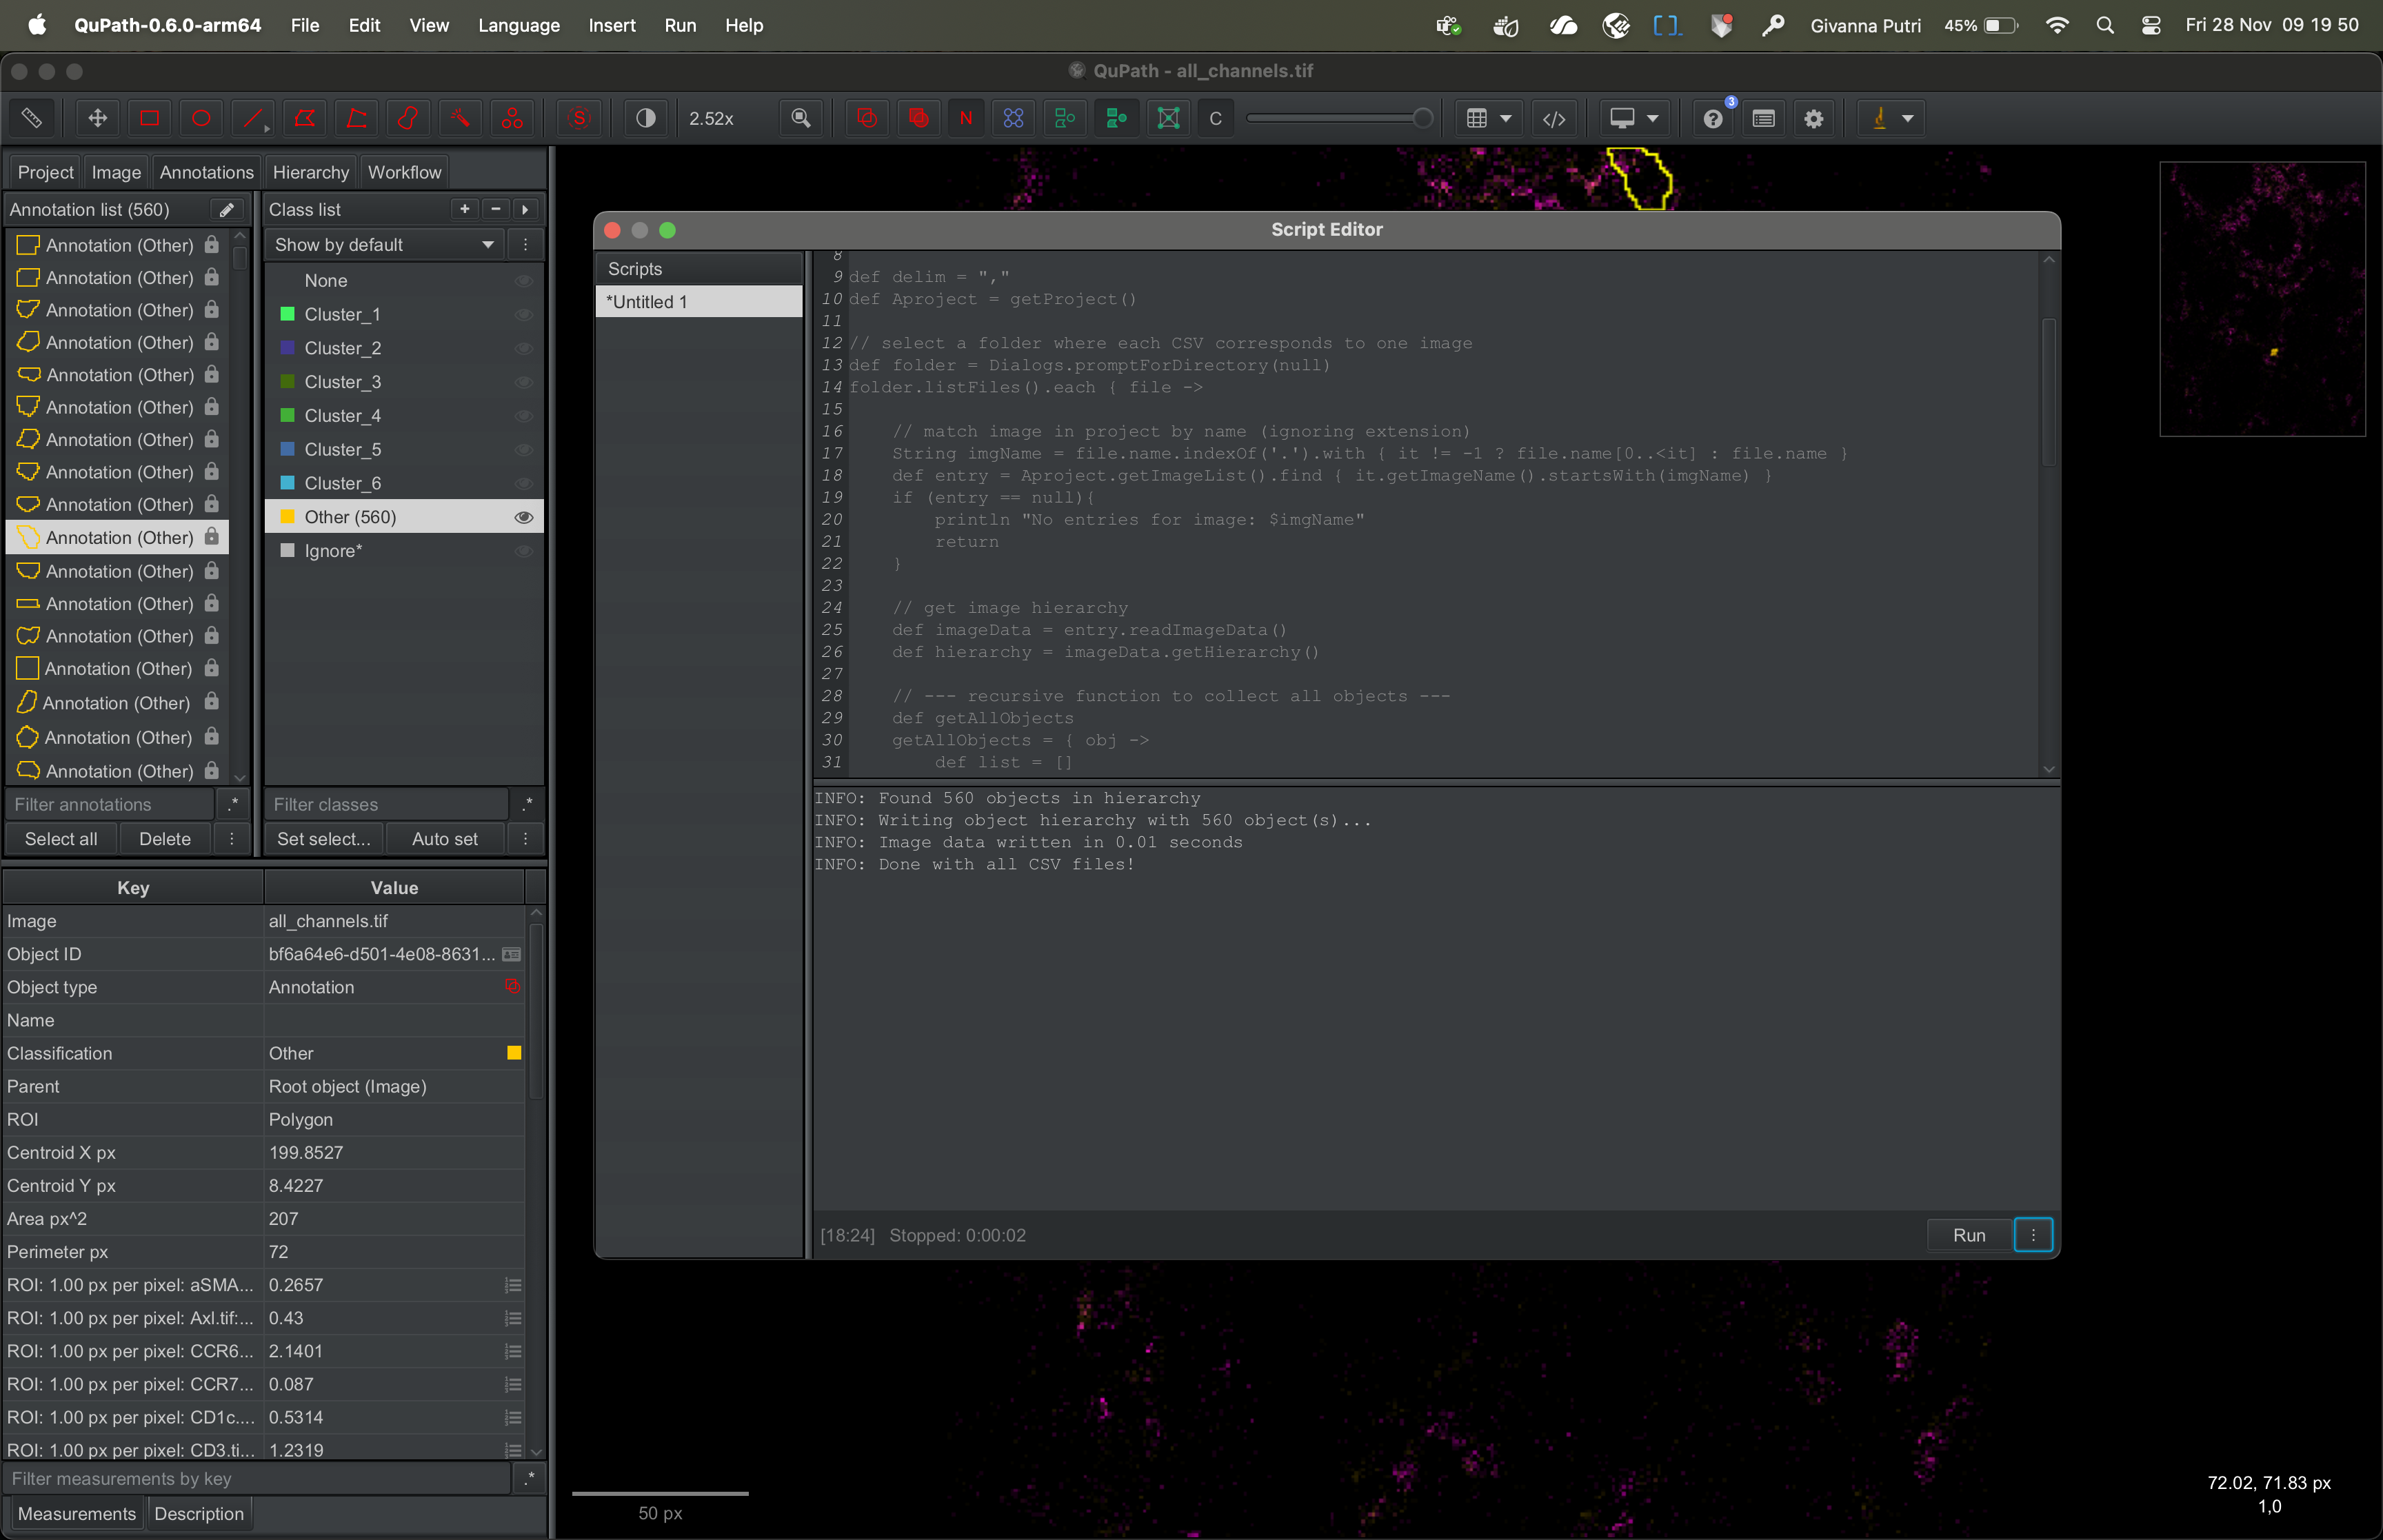
The script will run and load the cluster information to Qupath.
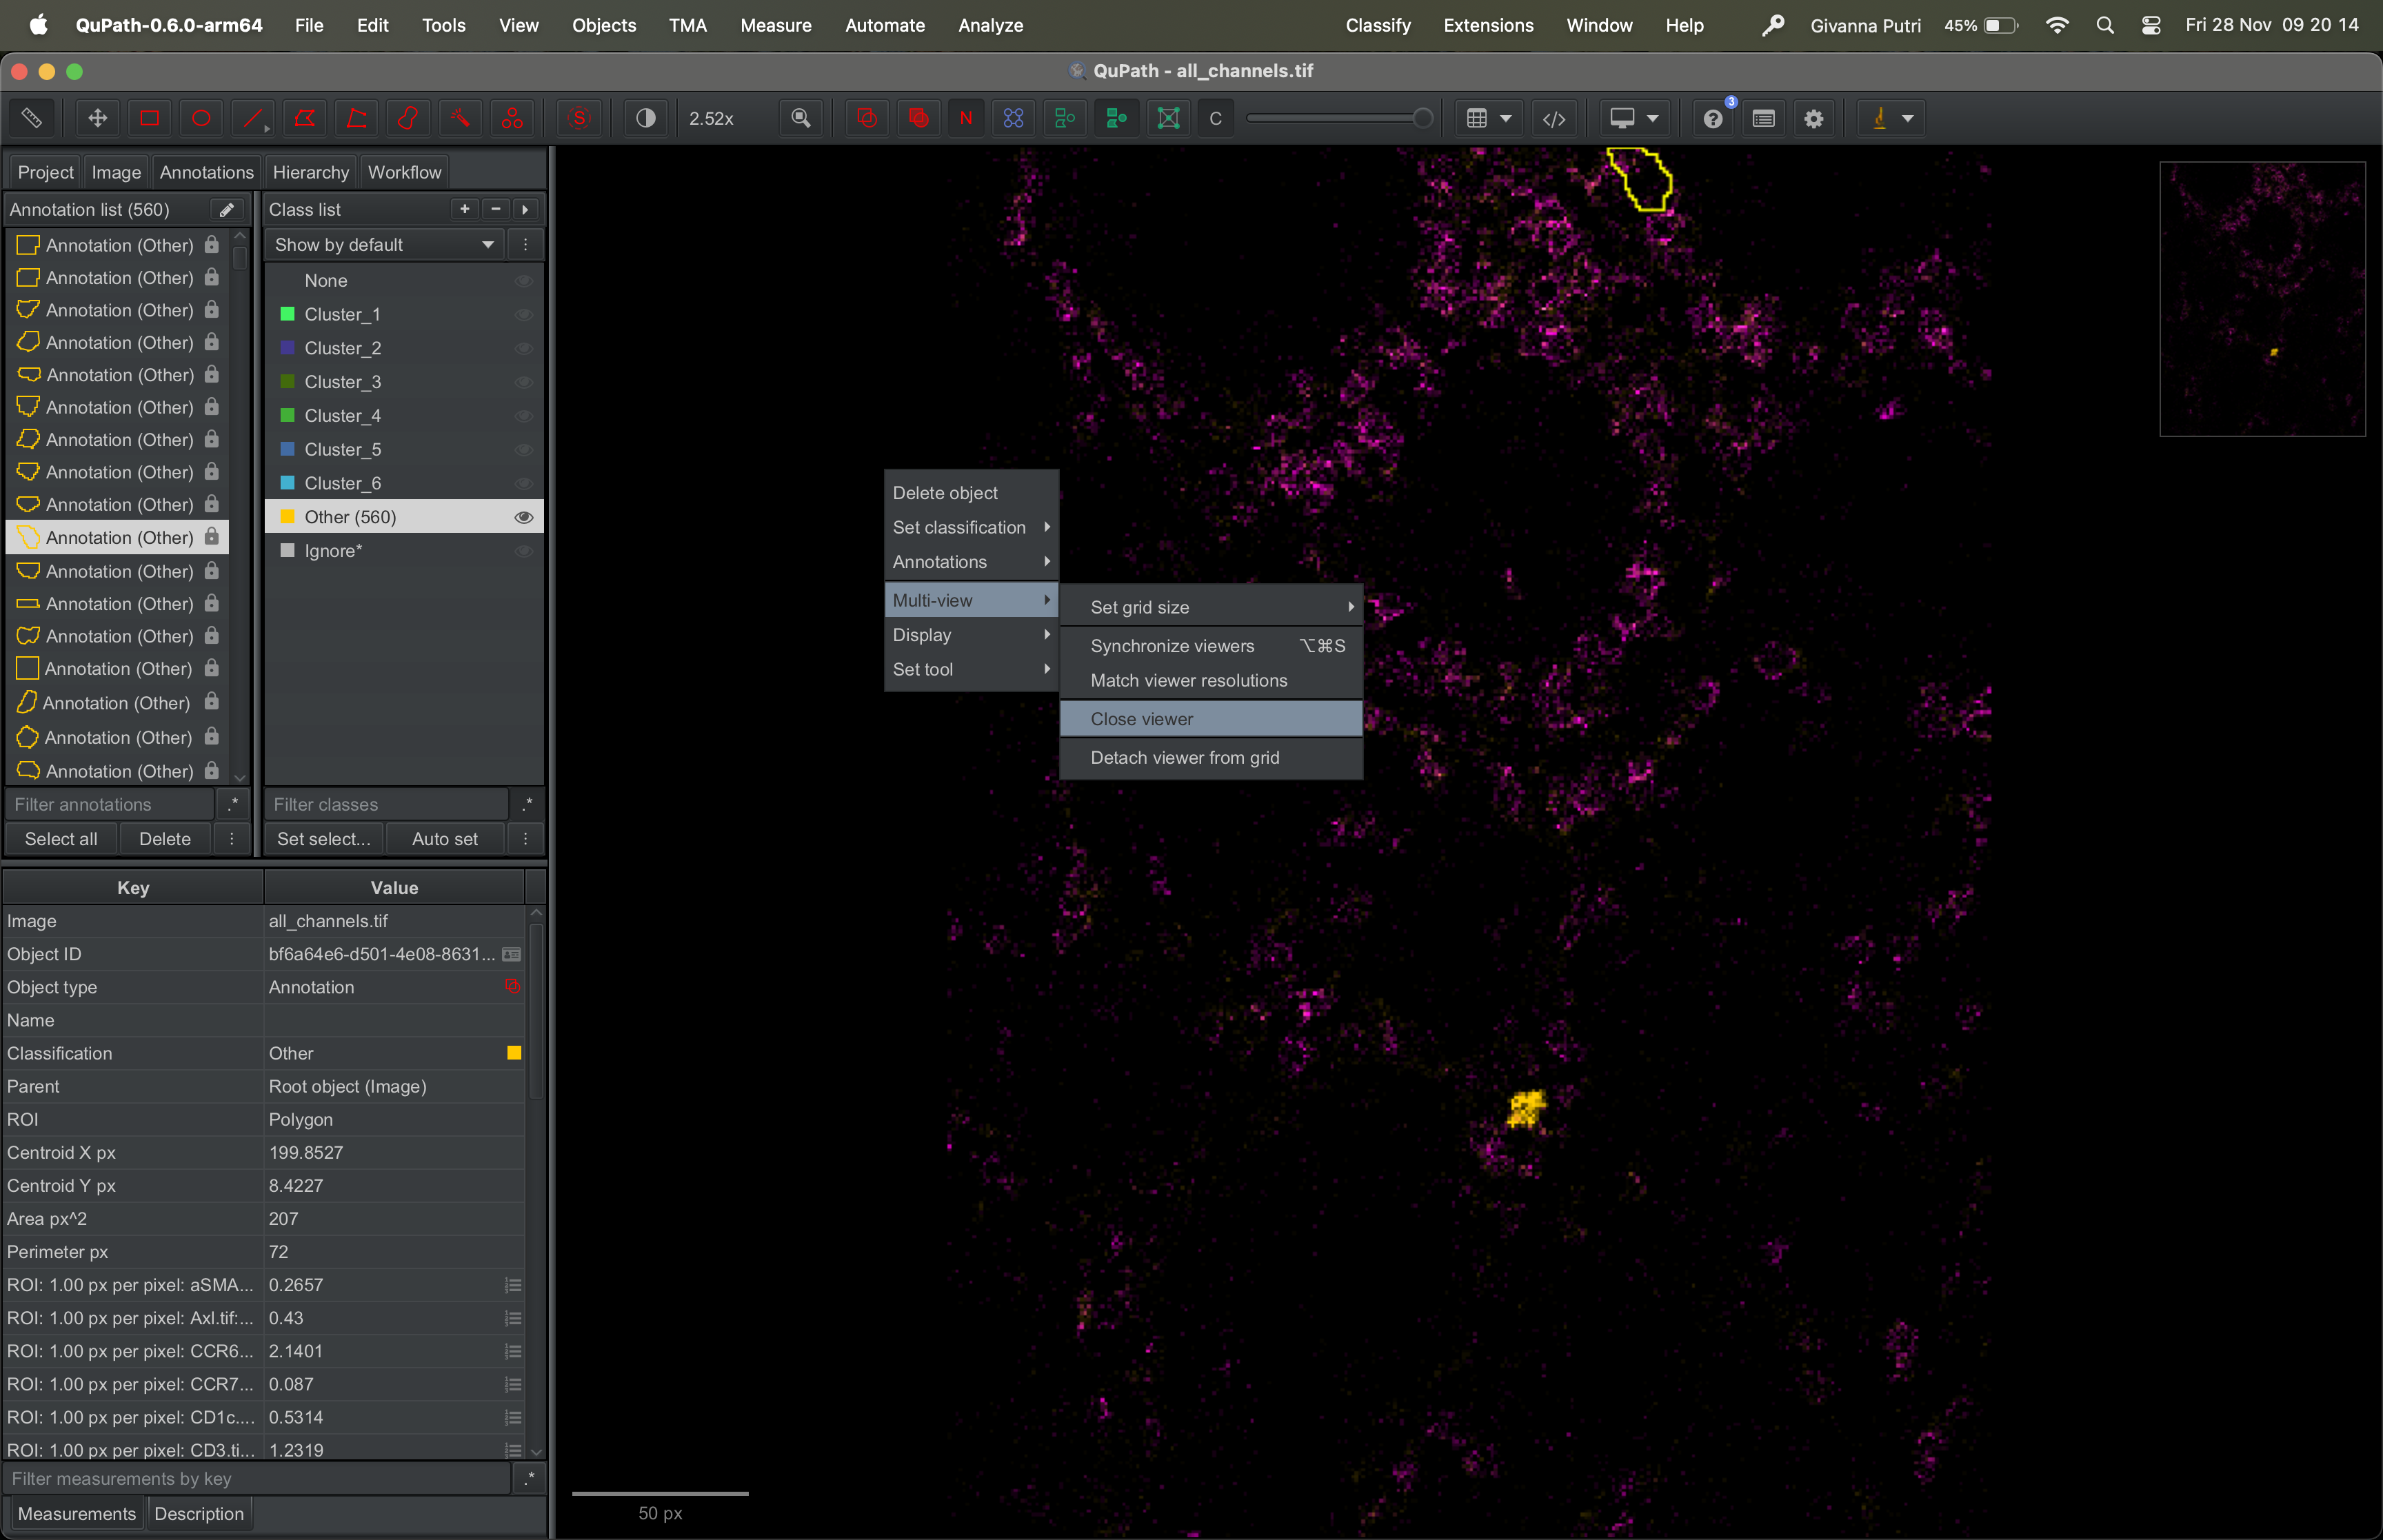
Visualising the clusters
To view the clusters, you need to first close the image and re-open it. Right click on the image, then select Multi-view -> Close viewer.
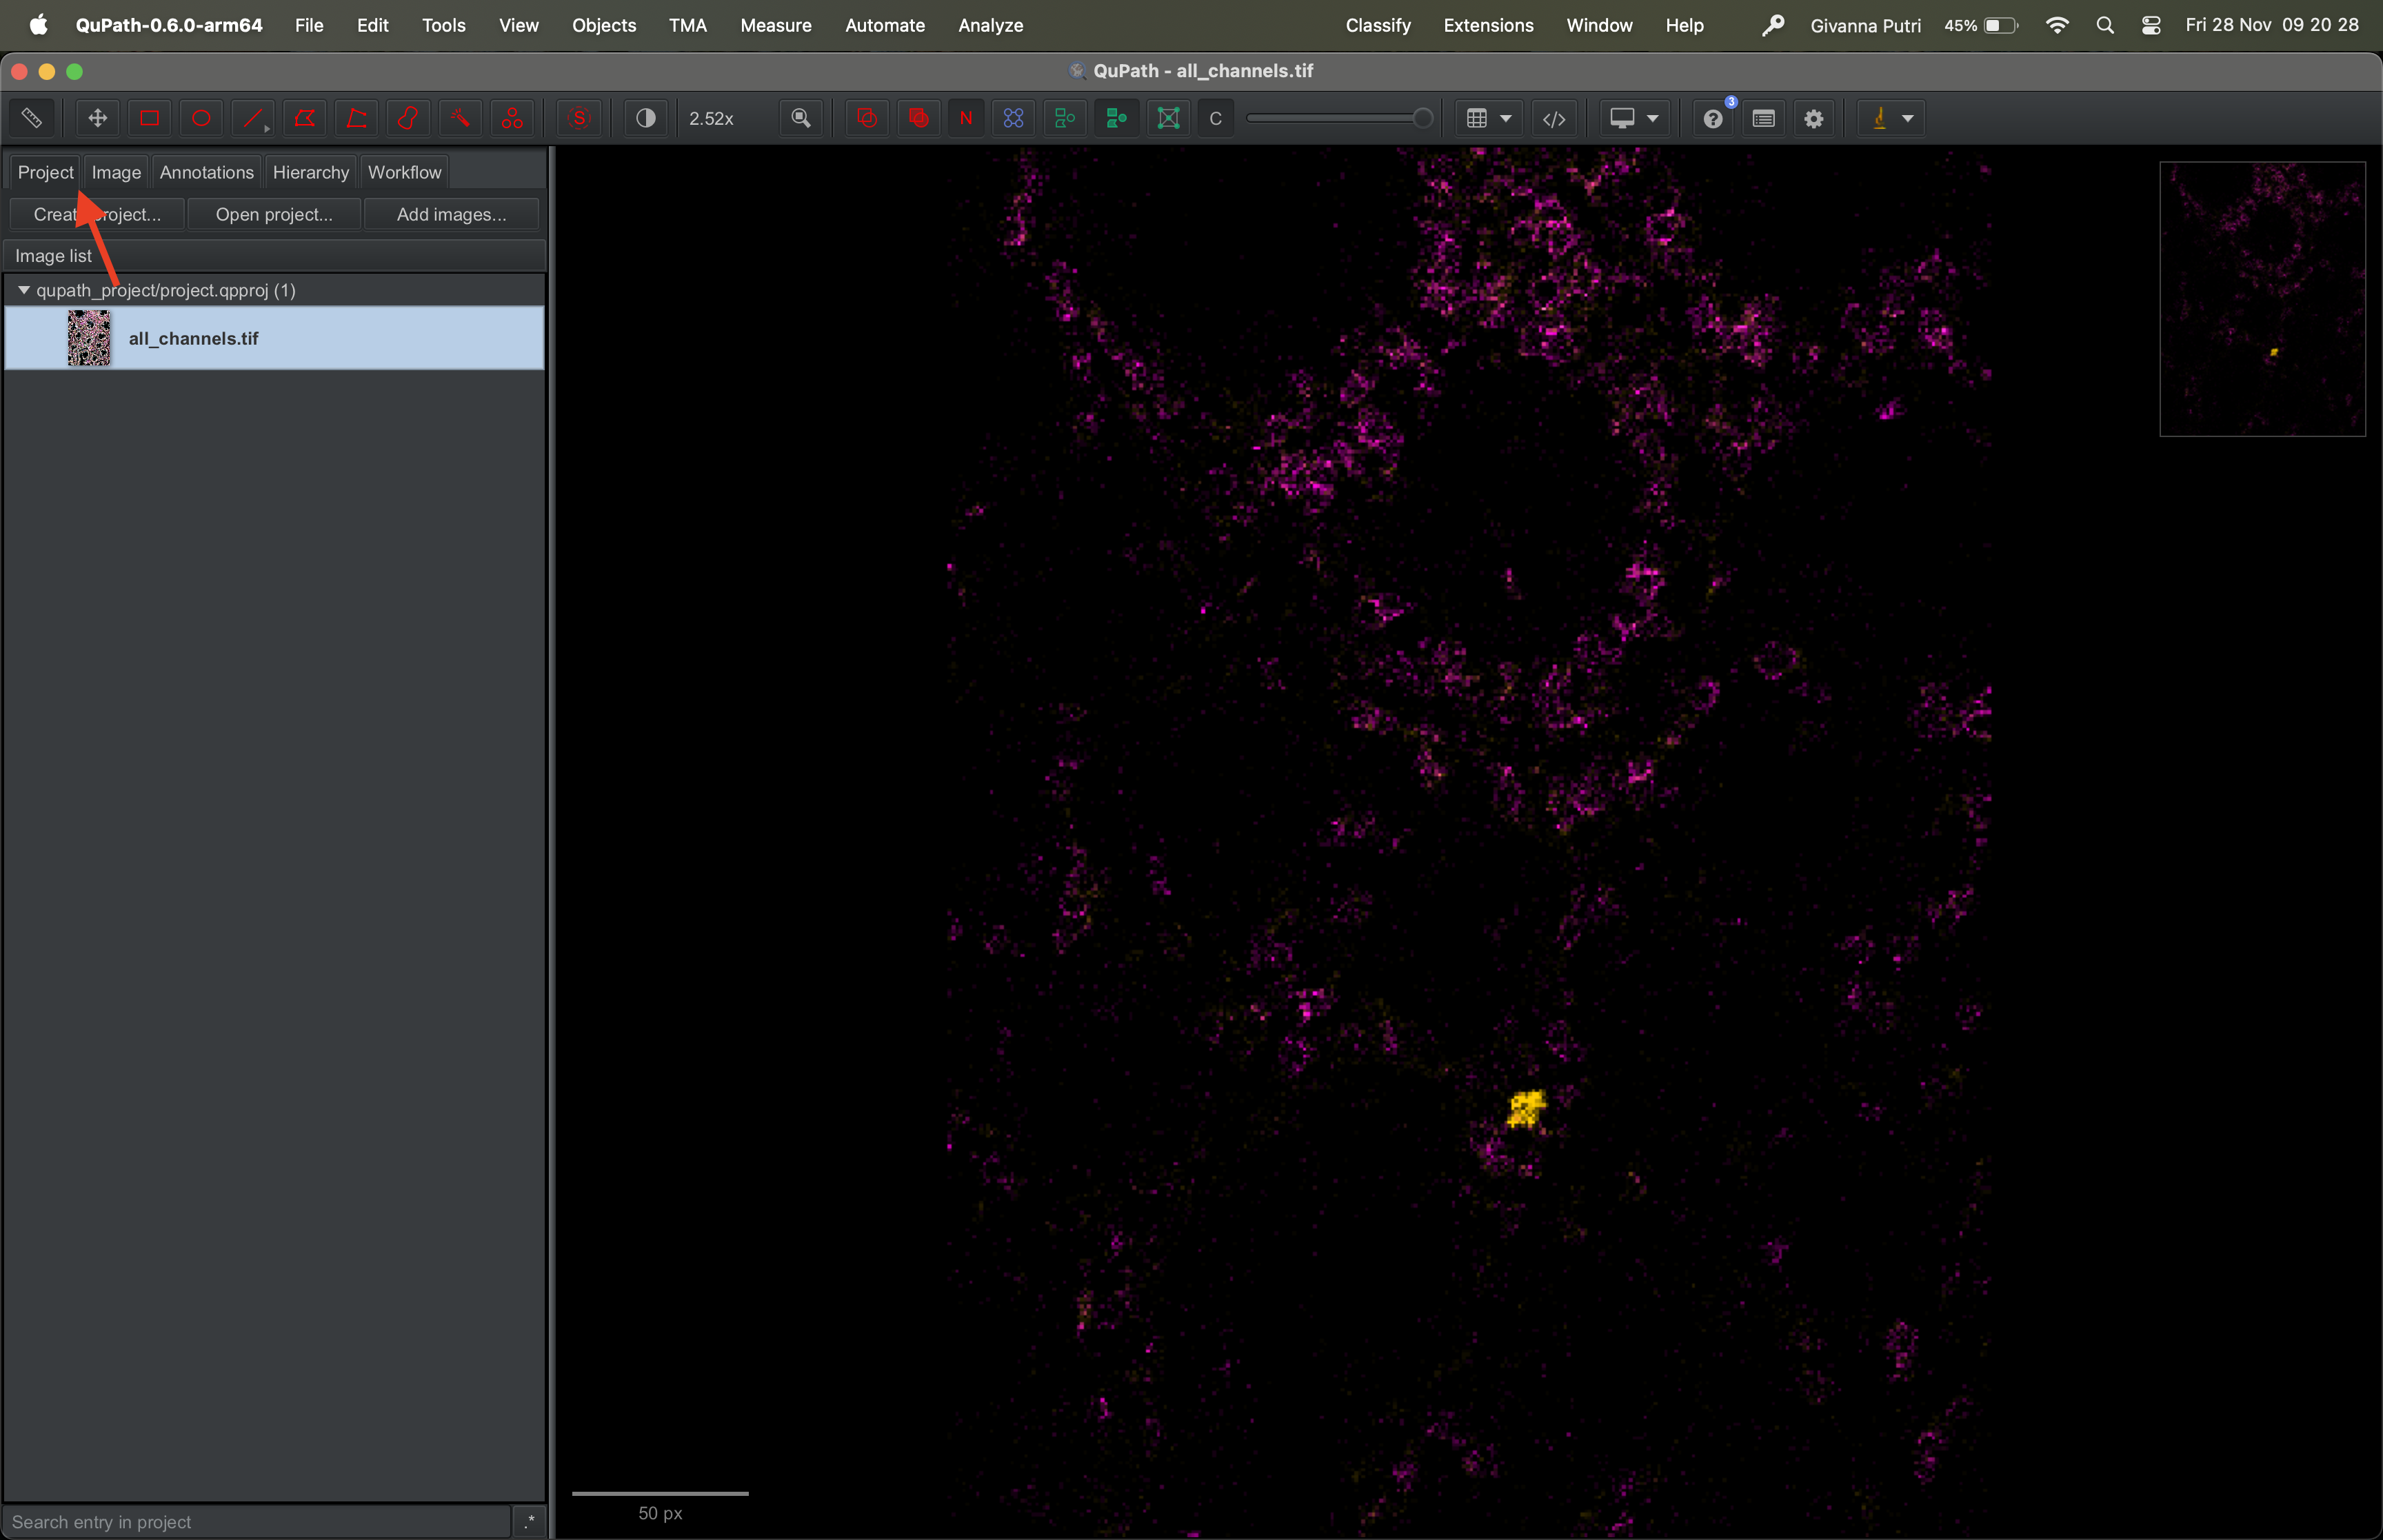
Go to the Project tab on the right panel, then click on the image
all_channels.tif to re-open it.
The annotation list should now contain a new annotation called
Clusters. Click on the triangle on the right of the class
list panel and select Population from existing objects -> All classes
(including sub-classes).
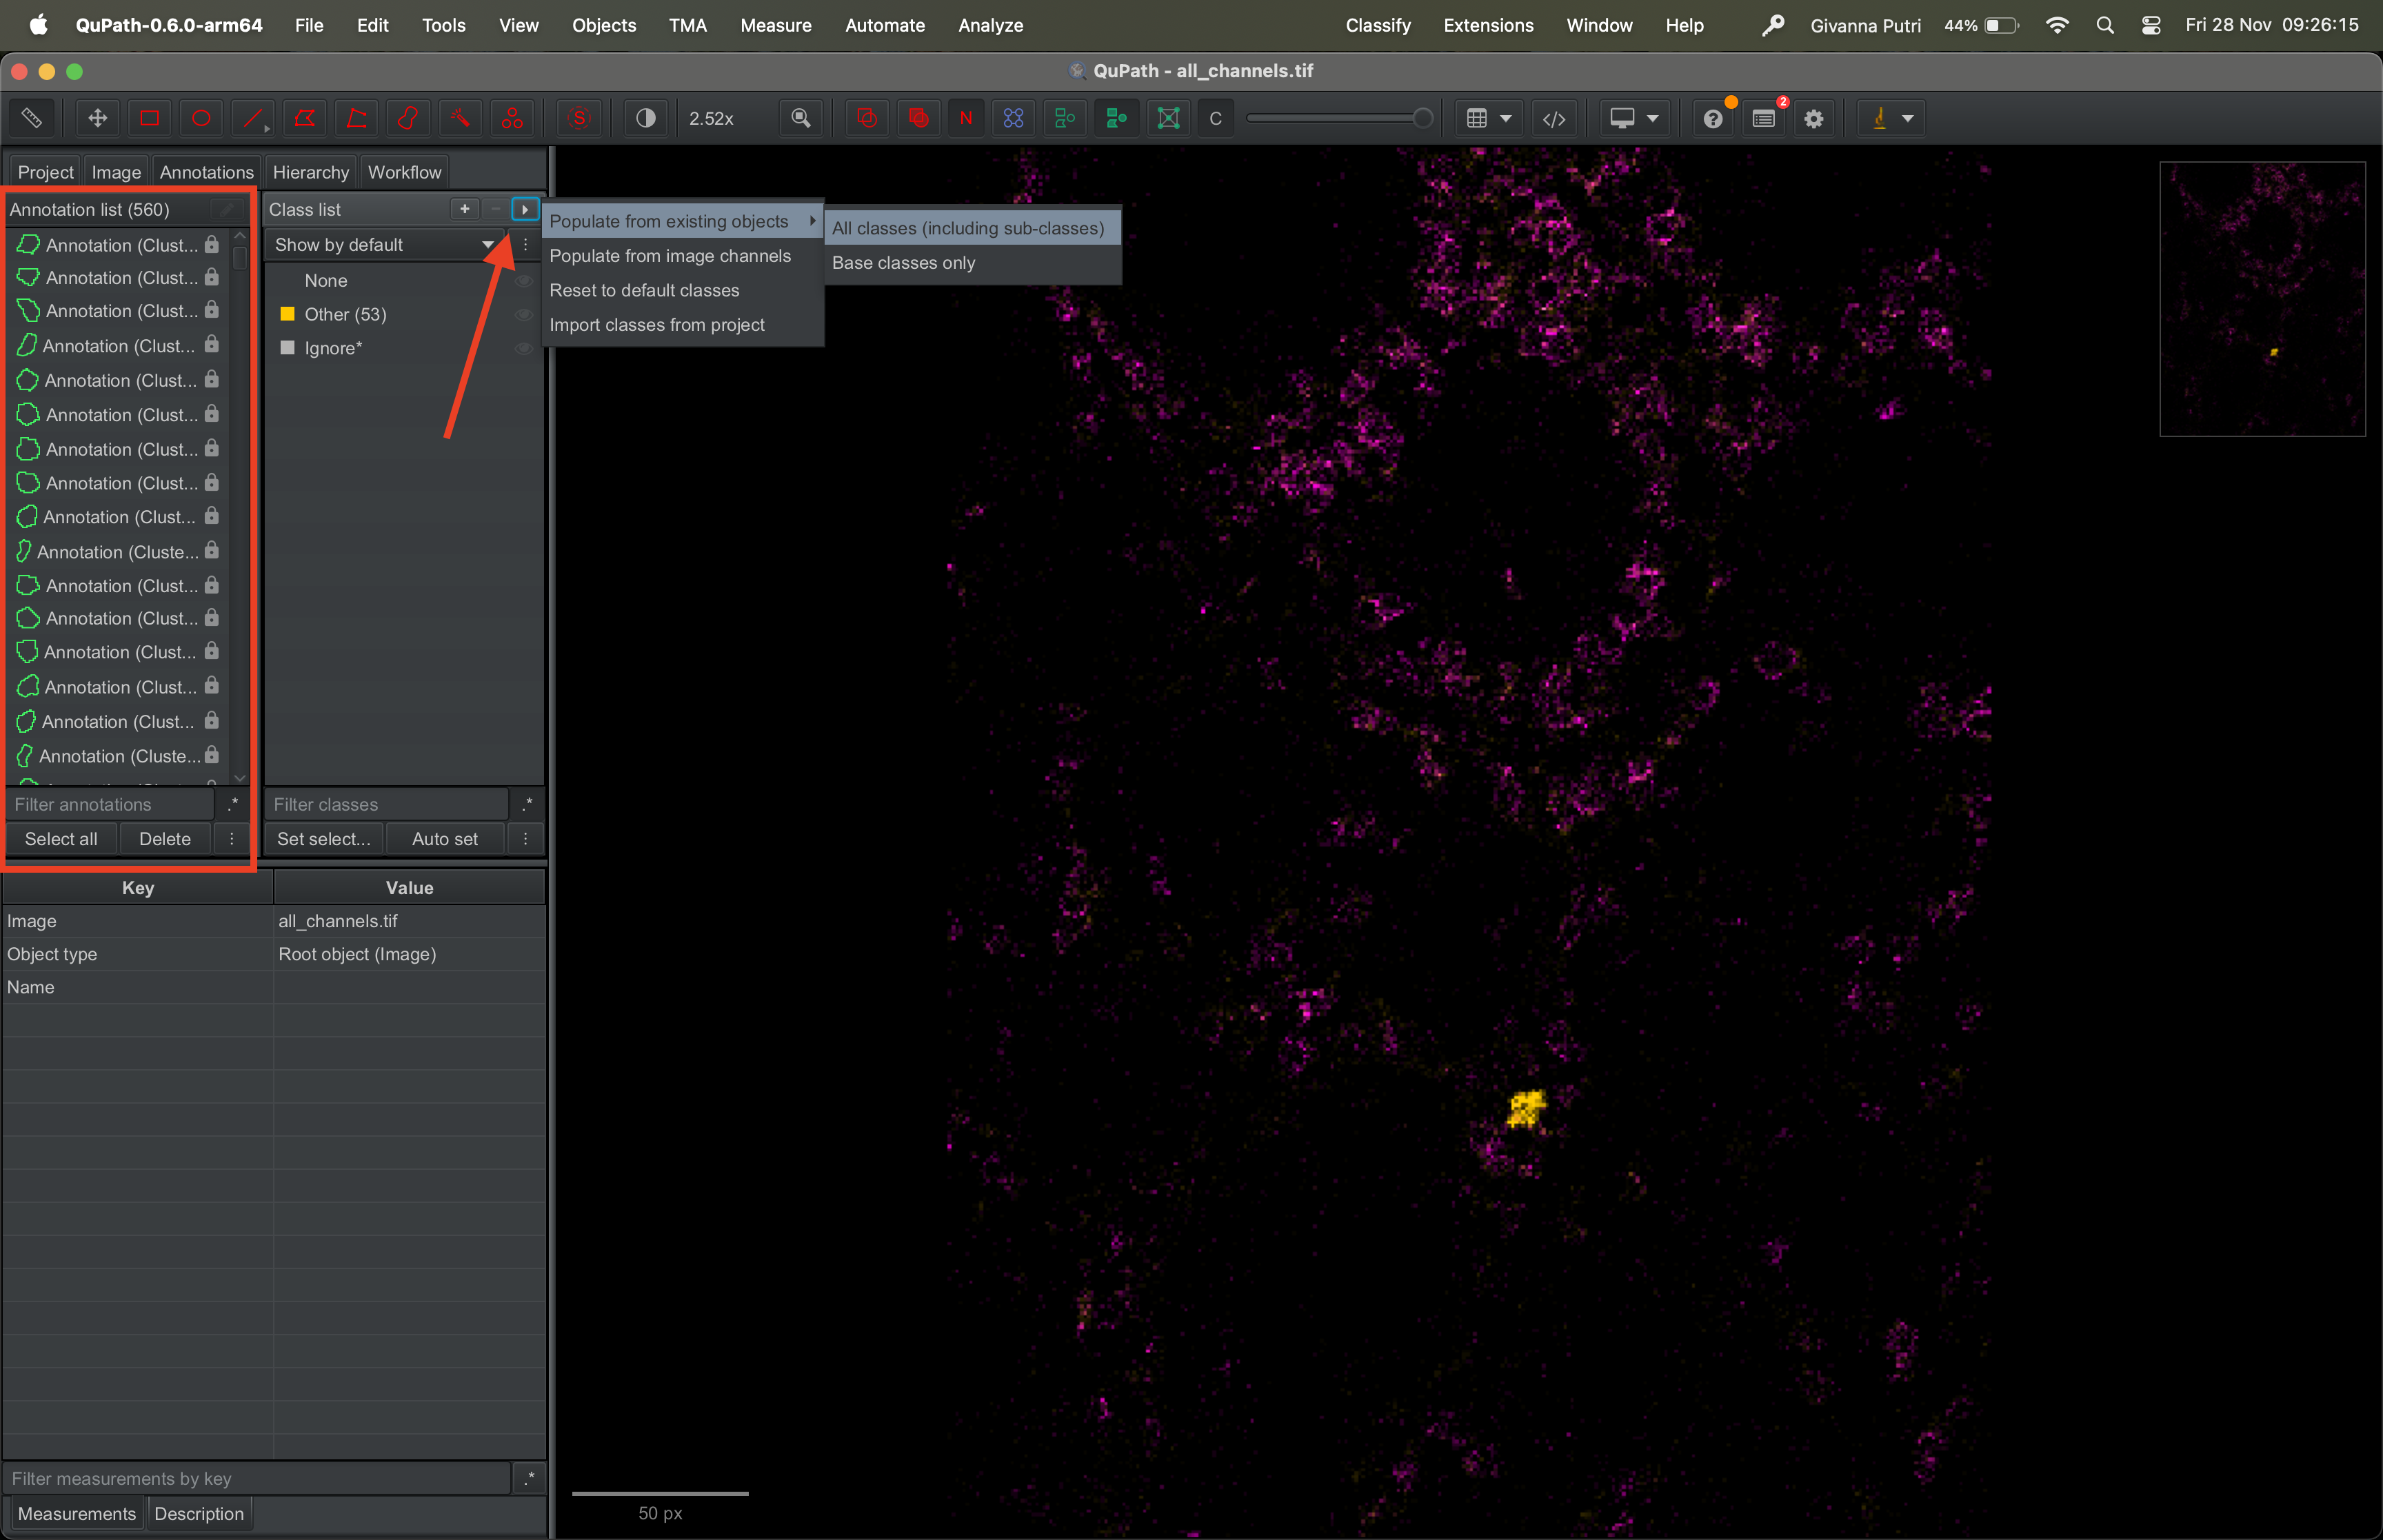
It’ll ask you whether you want to keep existing class or not, feel free to pick either option.
The class list should now contain the clusters we imported from R. This will allow you to select any given mask and assign it to a given cluster.
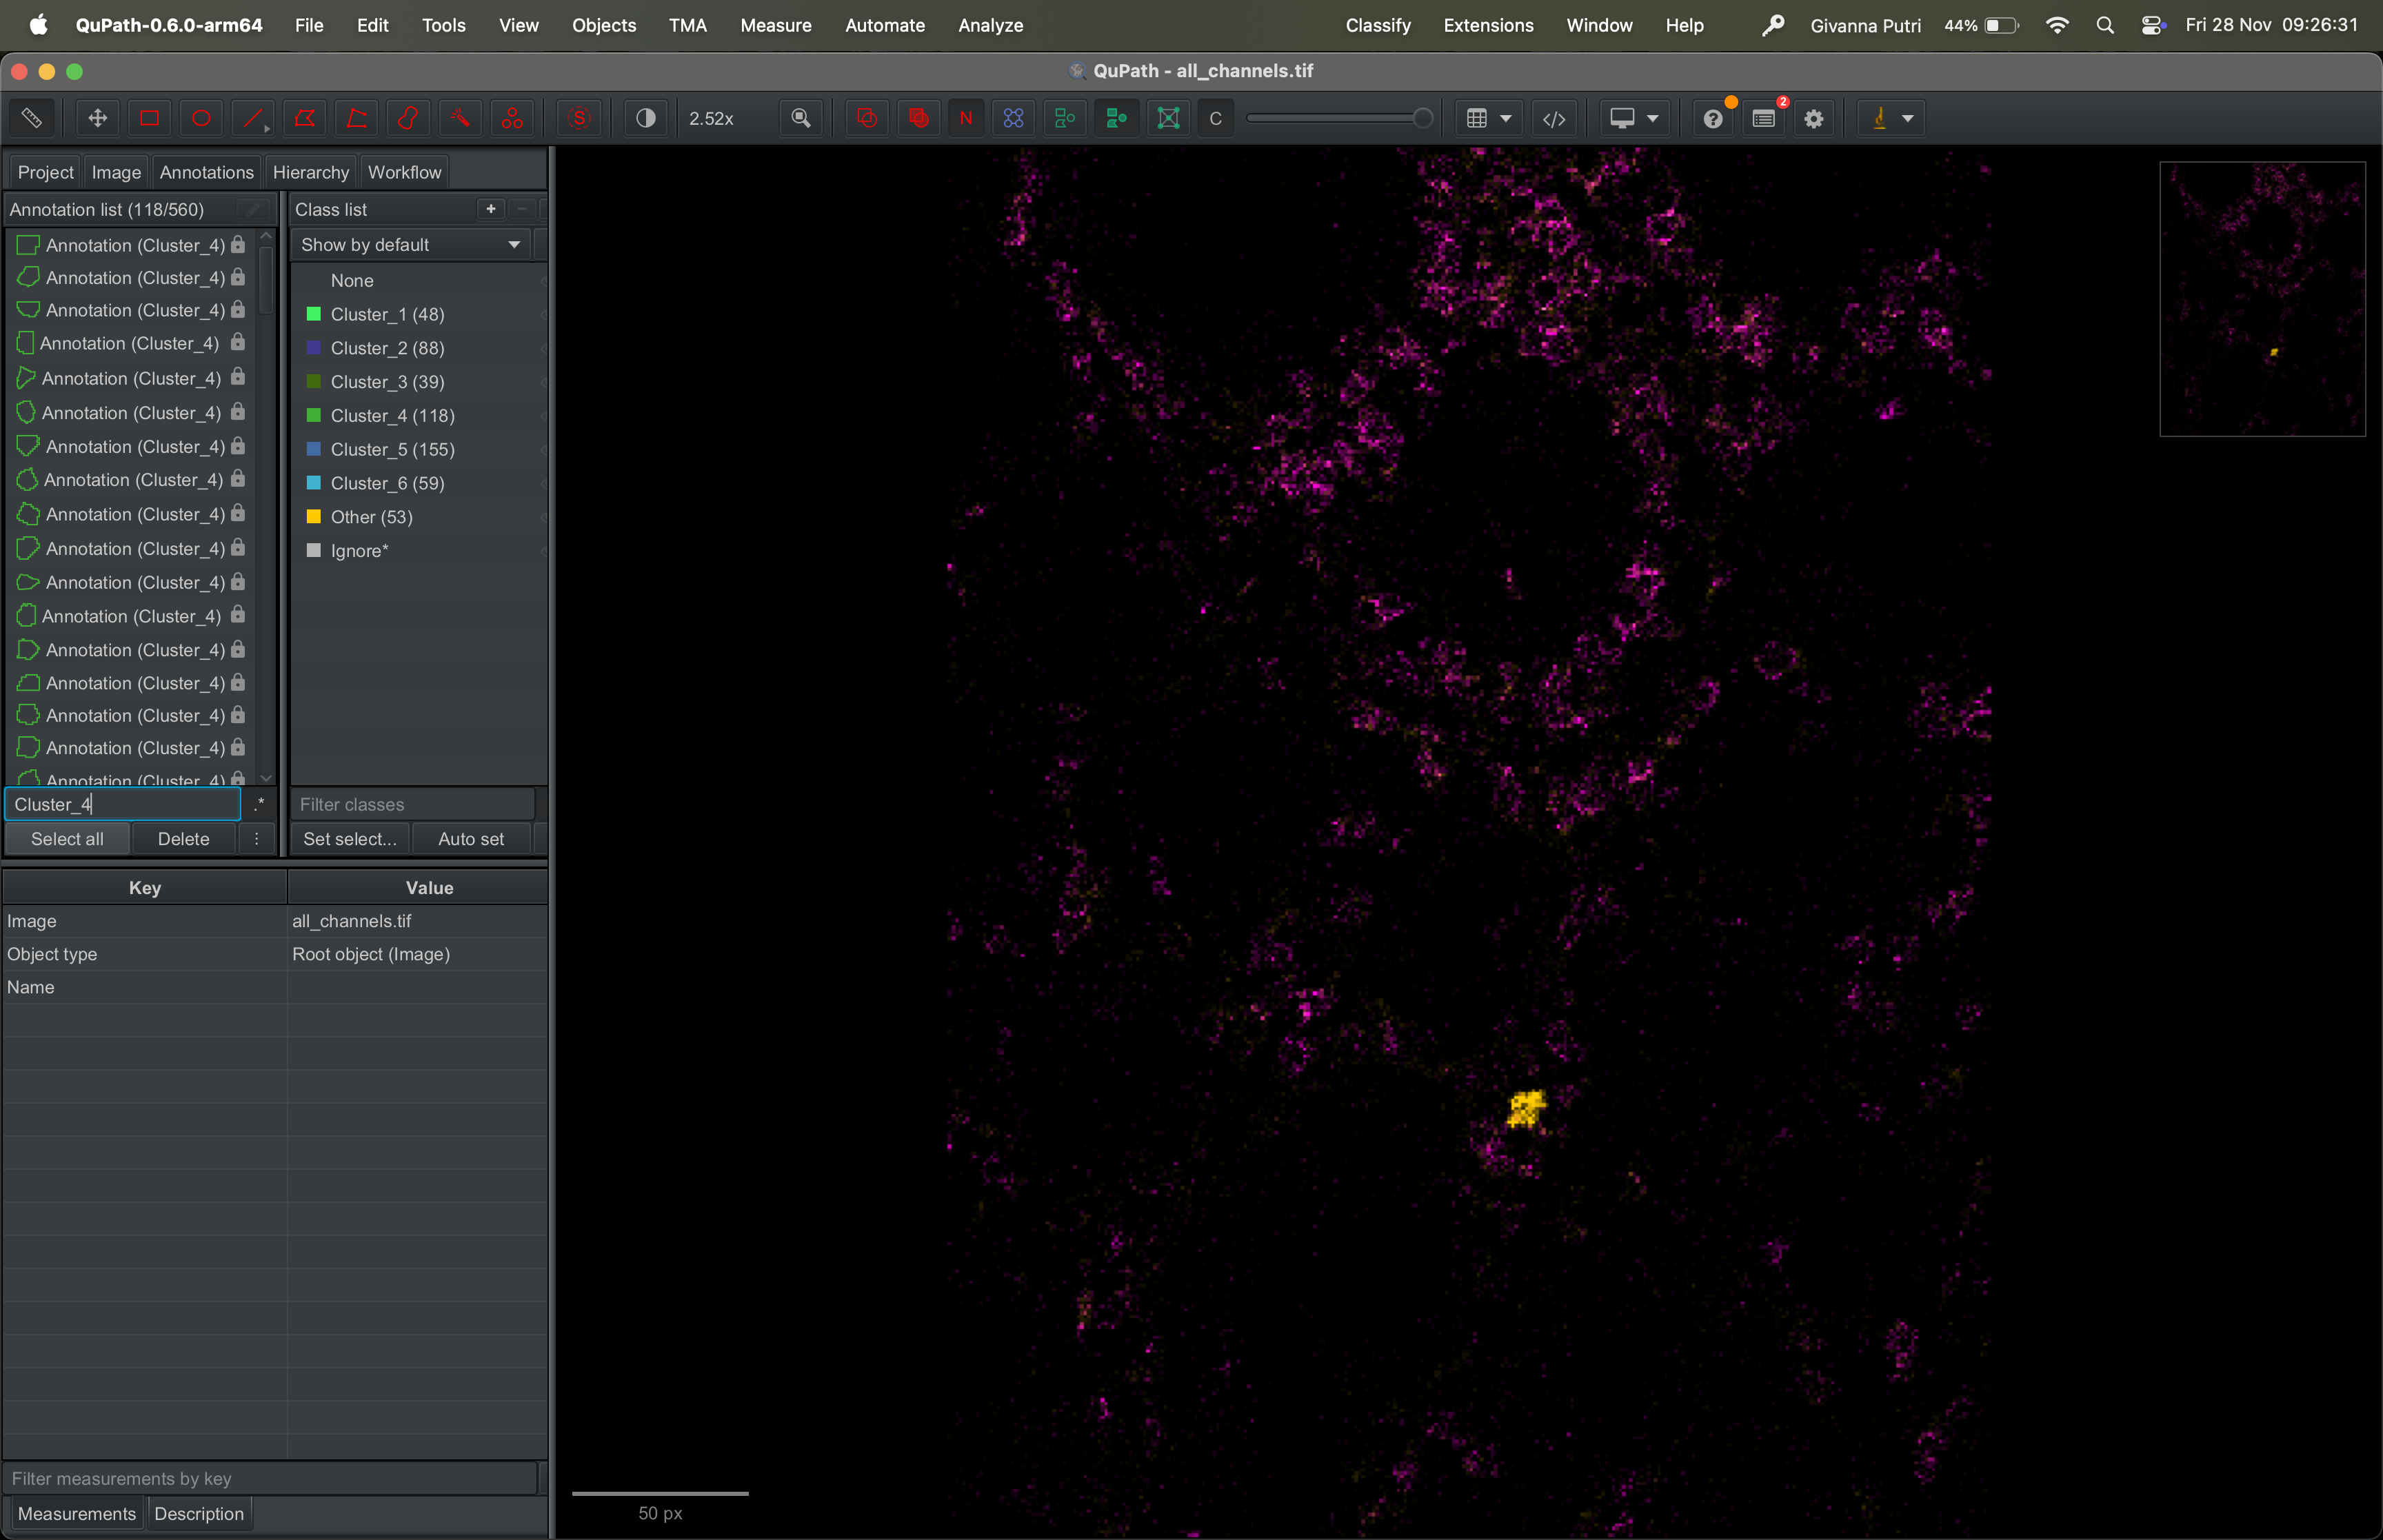
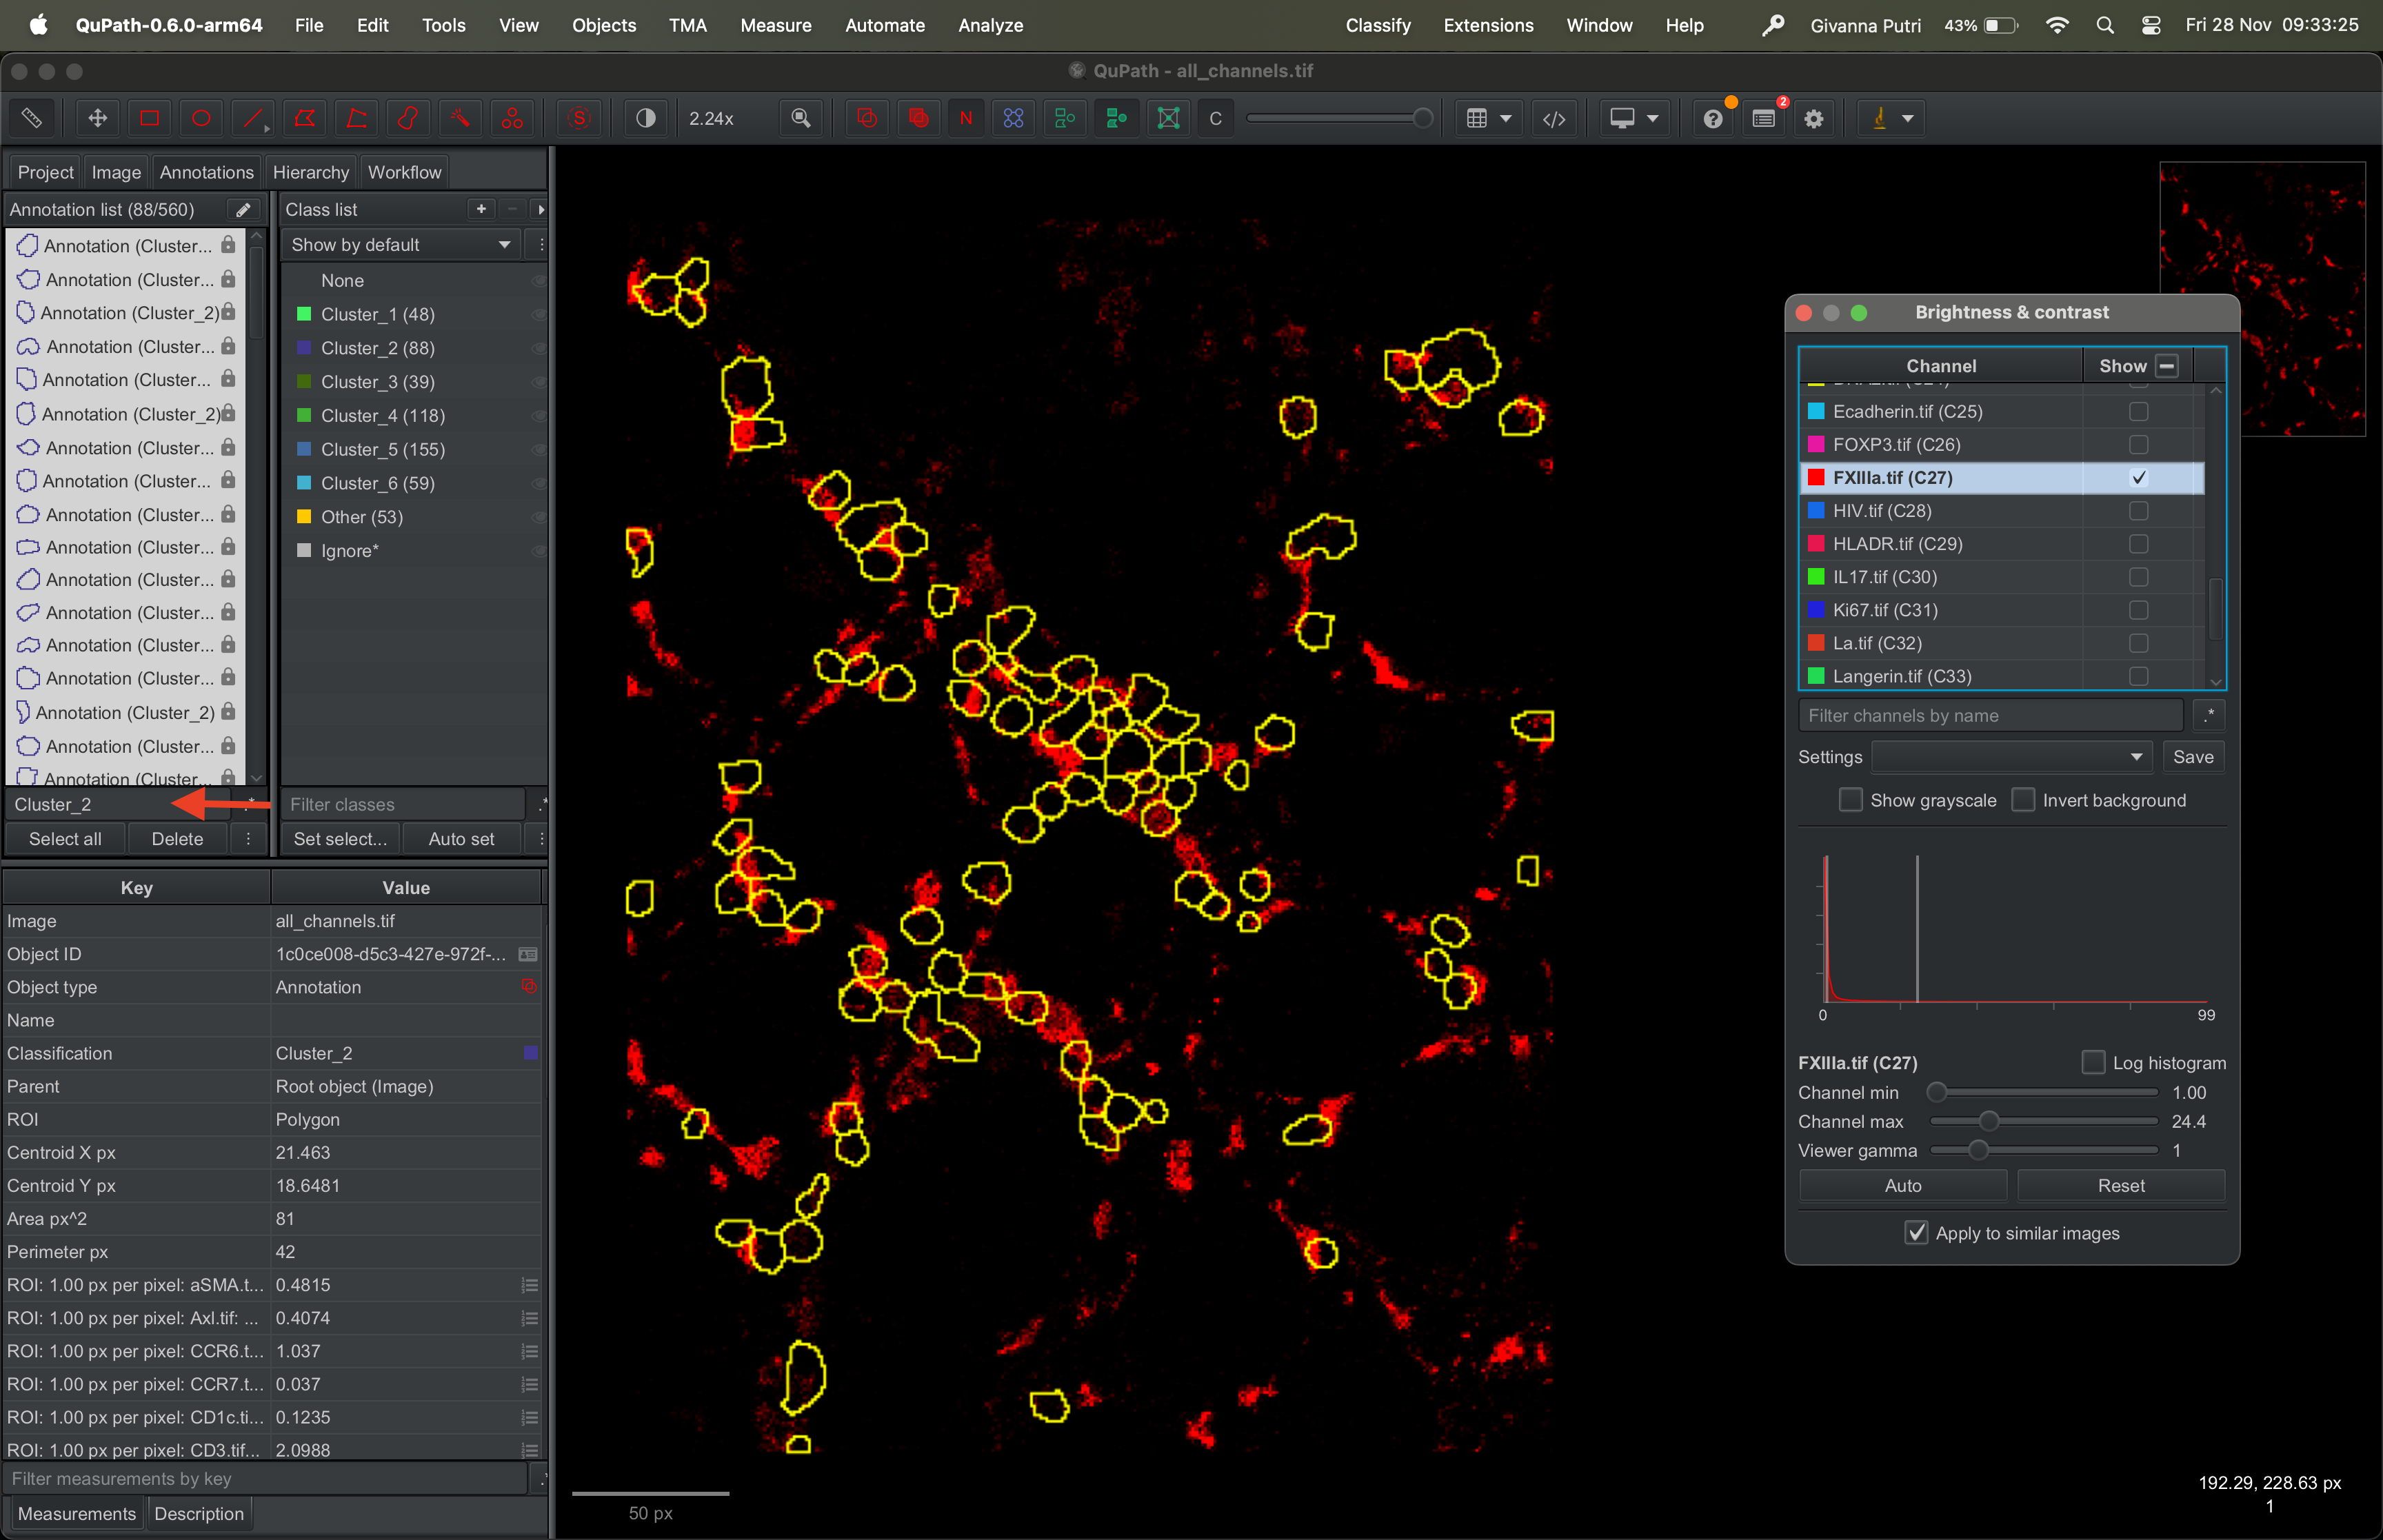
You can choose to show masks that are assigned to a given cluster by typing the cluster name in the search bar and click Select all button underneath it.
Pick a marker of your choice (e.g., FXIIIa) and visualise its expression across the selected clusters.
sessionInfo()R version 4.5.1 (2025-06-13)
Platform: aarch64-apple-darwin20
Running under: macOS Sequoia 15.5
Matrix products: default
BLAS: /Library/Frameworks/R.framework/Versions/4.5-arm64/Resources/lib/libRblas.0.dylib
LAPACK: /Library/Frameworks/R.framework/Versions/4.5-arm64/Resources/lib/libRlapack.dylib; LAPACK version 3.12.1
locale:
[1] en_US.UTF-8/en_US.UTF-8/en_US.UTF-8/C/en_US.UTF-8/en_US.UTF-8
time zone: Australia/Perth
tzcode source: internal
attached base packages:
[1] stats graphics grDevices utils datasets methods base
other attached packages:
[1] workflowr_1.7.2
loaded via a namespace (and not attached):
[1] vctrs_0.6.5 httr_1.4.7 cli_3.6.5 knitr_1.50
[5] rlang_1.1.6 xfun_0.53 stringi_1.8.7 processx_3.8.6
[9] promises_1.3.3 jsonlite_2.0.0 glue_1.8.0 rprojroot_2.1.1
[13] git2r_0.36.2 htmltools_0.5.8.1 httpuv_1.6.16 ps_1.9.1
[17] sass_0.4.10 rmarkdown_2.29 jquerylib_0.1.4 tibble_3.3.0
[21] evaluate_1.0.5 fastmap_1.2.0 yaml_2.3.10 lifecycle_1.0.4
[25] whisker_0.4.1 stringr_1.5.2 compiler_4.5.1 fs_1.6.6
[29] pkgconfig_2.0.3 Rcpp_1.1.0 rstudioapi_0.17.1 later_1.4.4
[33] digest_0.6.37 R6_2.6.1 pillar_1.11.0 callr_3.7.6
[37] magrittr_2.0.4 bslib_0.9.0 tools_4.5.1 cachem_1.1.0
[41] getPass_0.2-4